- The BlockStreet Journal
- Posts
- ETH Cycle Sentiment Tanks
ETH Cycle Sentiment Tanks
PLUS: Analysis on ETH, SUI & WLD

Blockstreet Journal
In Partnership With:

Market Watch
Fear & Greed

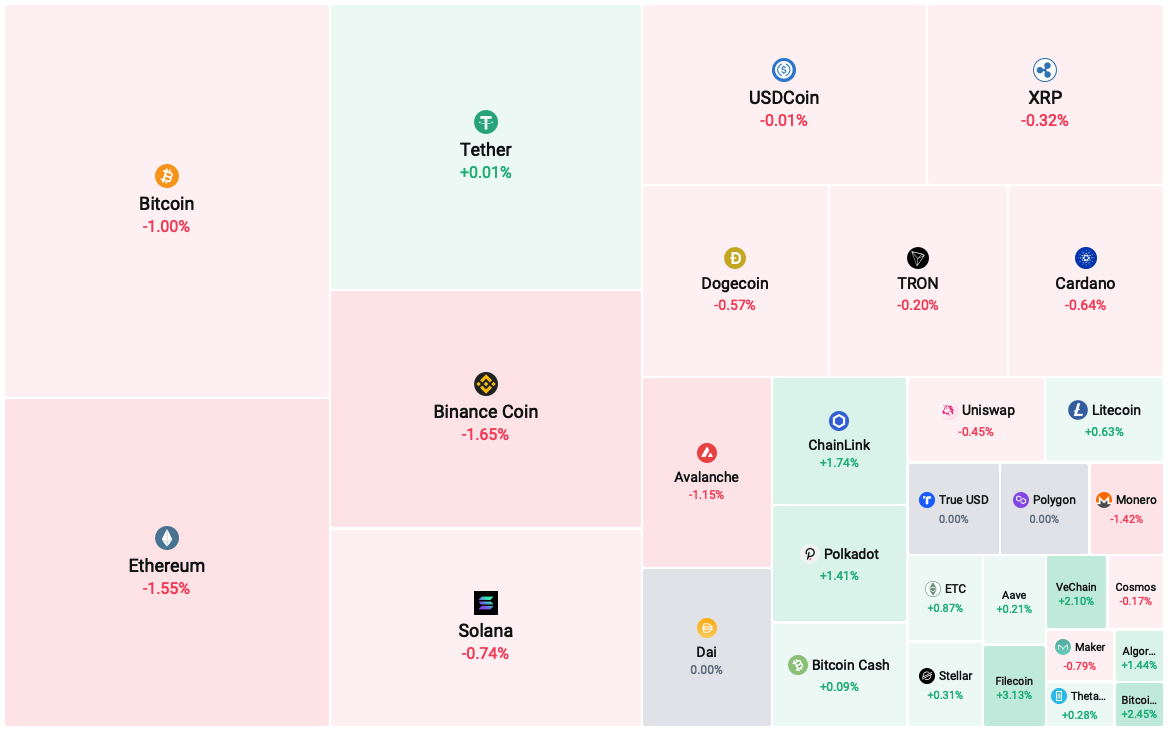
Heatmap
Top Movers
🚀 Top Gainers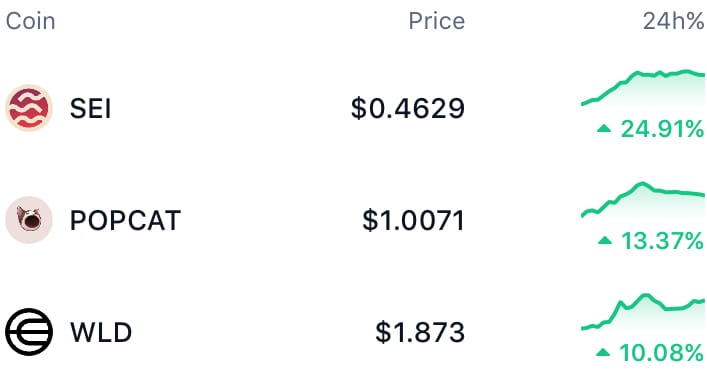
| 💩Top Losers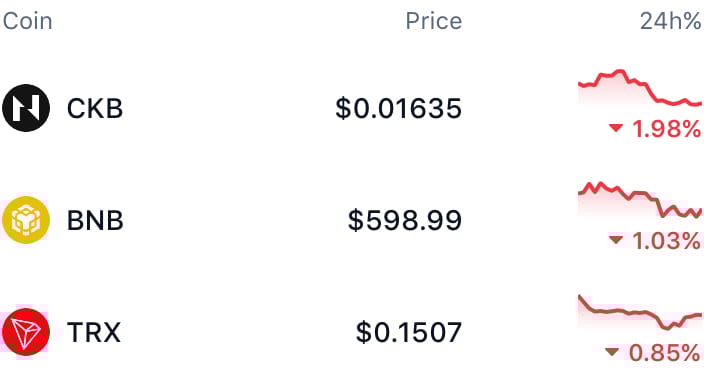 |
Latest Updates
ETHEREUM
📉 ETH Cycle Sentiment Tanks

Word On The Street: Despite a 15% rally over the past two weeks, ETH has struggled to maintain upward momentum, consolidating between $2,700 and $2,600 this week.
The details:
In a filing on Sept. 24, the SEC announced a delay in its decision to approve options trading for spot Ethereum ETFs.
Following the SEC’s announcement, the odds of Ethereum reaching a new all-time high (ATH) in 2024 have shifted significantly on Polymarket.
The likelihood of ETH missing a new ATH in 2024 has risen to 85%, up from 71% a week ago.
Why it matters: After hitting a recent high of $2,702 on Monday, Ethereum’s price has moved sideways over the last 48 hours, indicating a period of consolidation between buyers and sellers.
SPONSORED BY TRADINGVIEW
💹 Traders Choice For Terminals

Word on the Street: TradingView Offers Advanced Tools and Seamless Trading.TradingView provides everything you need for a powerful trading experience.
The Details:
Access a wide range of indicators and drawing tools.
Customize and analyze charts with ease.
Test and execute your strategies automatically.
Trade directly on TradingView by connecting your broker.
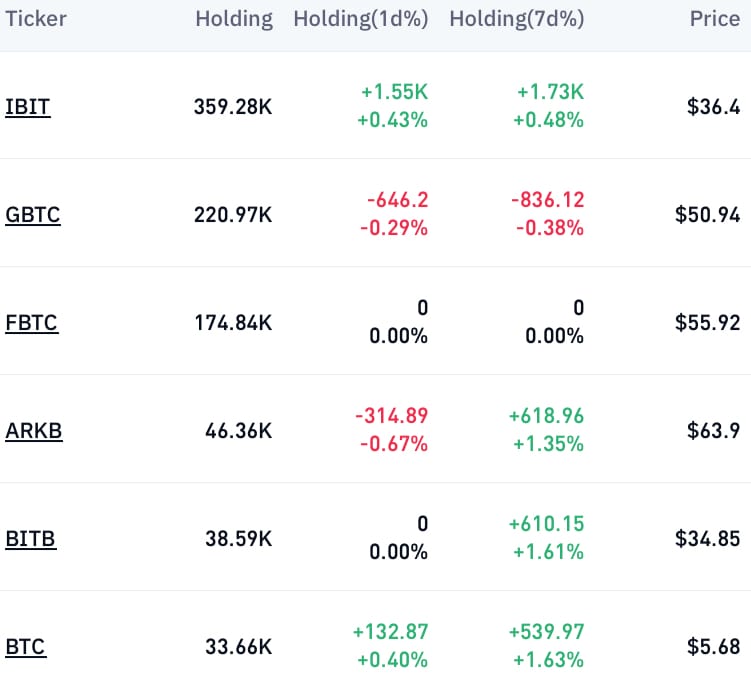
Institution Holdings
Bitcoin ETFs
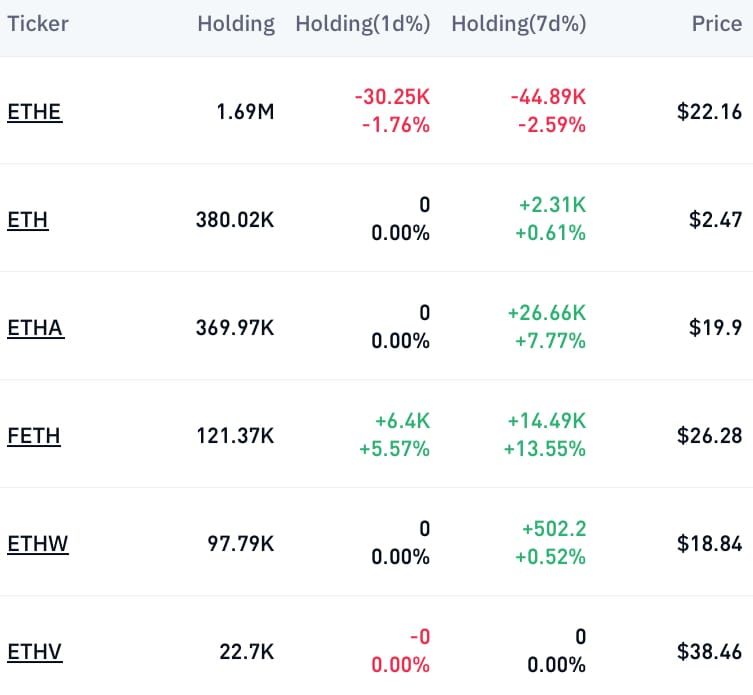
Ethereum ETFs
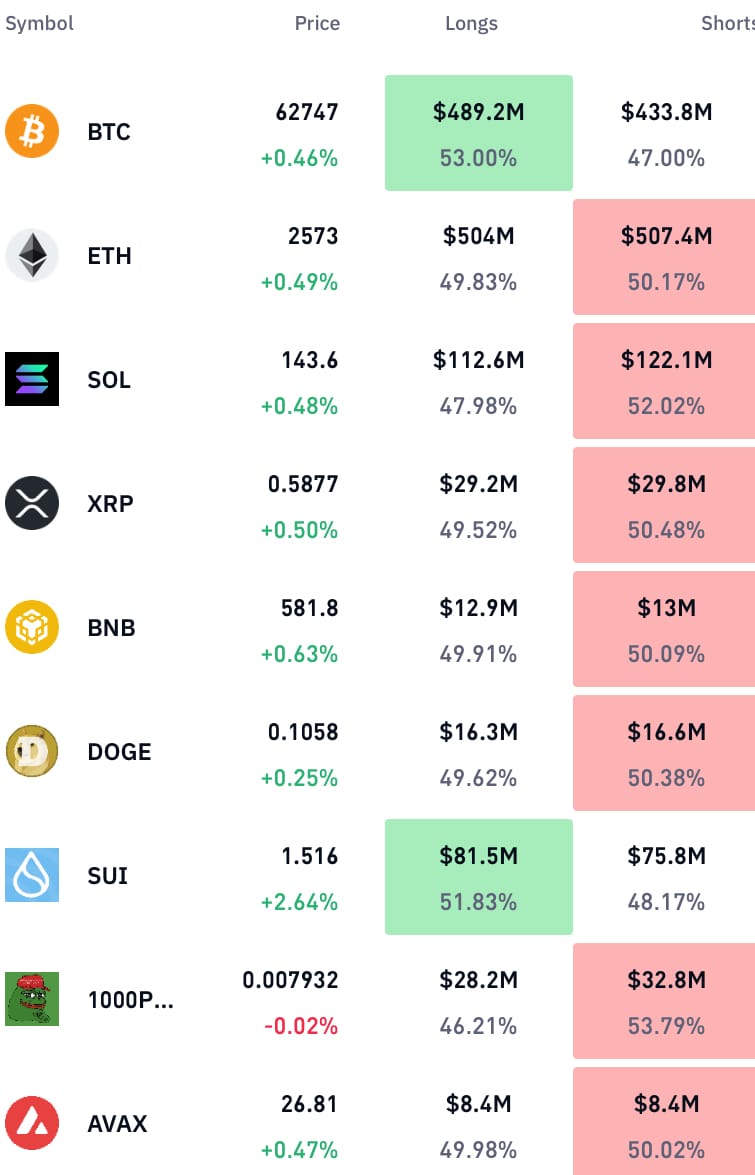
Longs & Shorts
Traders Corner (Premium)
Welcome, Traders!
Traders Corner is the premium section of The Blockstreet Journal. We provide one free report out of appreciation ❤️
Reports from our analysts today:
Ethereum Technical Analysis
SUI Technical Analysis
WorldCoin Technical Analysis
TRADERS CORNER
💸 Ethereum Technical Analysis
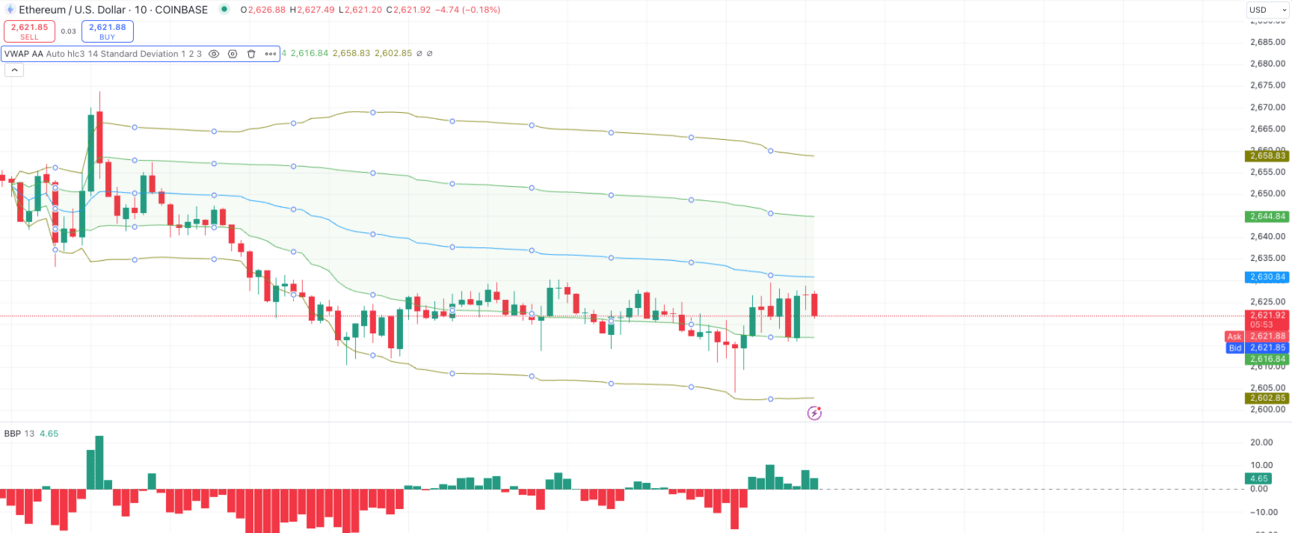
Ethereum is trading at approximately $2,621.92, slightly above the middle VWAP band at $2,616.84. This suggests neutral to slightly bullish momentum as the price is hovering around the VWAP, without showing a strong directional bias.
Trend Analysis:
The chart indicates a consolidation phase after Ethereum experienced a drop toward the lower VWAP band. The price is now rebounding but remains within a narrow trading range between the middle and upper VWAP bands. The recent increase in green volume bars indicates some buying interest, though not enough to confirm a strong upward move yet. The narrowing of the VWAP bands reflects a decrease in volatility, which suggests that Ethereum may continue to trade sideways unless there is a significant shift in market sentiment.
Support and Resistance:
- Resistance: The upper VWAP deviation band at $2,658.83 serves as the immediate resistance. If Ethereum breaks above this level, the next resistance could be at $2,670.00, a psychological barrier that might see further selling pressure.
- Support: The first support is at the middle VWAP band near $2,616.84. If Ethereum fails to hold this level, the lower VWAP band around $2,602.85 could act as a stronger support zone.
Potential Scenarios:
Bullish: If Ethereum maintains its position above the middle VWAP band and bullish momentum increases, it could push toward the upper VWAP band at $2,658.83. A sustained break above this level would indicate a possible continuation of the uptrend, with the price potentially targeting the $2,670.00 resistance level.
Bearish: If Ethereum loses its position near the middle VWAP band and selling pressure increases, the price could fall to test the lower VWAP band at $2,602.85. A break below this level could signal further downside, with the next potential target around $2,590.00.
Subscribe to Premium to read the rest.
Become a paying subscriber of Premium to get access to this post and other subscriber-only content.
Already a paying subscriber? Sign In.
A subscription gets you:
- • Support What We do
- • Ad-Free Reading
- • Daily Technical Analysis Reports (M-F)
- • Price Locked (Protected From Future Price Increases)
Reply